Heart rate variability has become a star metric of consumer wearables, but most users receive a number each morning with limited context for what it actually reflects. A reading of 42ms or 68ms or 91ms is not meaningful on its own. What makes overnight HRV useful is understanding why sleep is the right window to measure it, what the number is actually capturing, what moves it up and down, and how to read a trend rather than a single data point.
Today we cover all of that, plus the detail that most platform builders need to understand: devices do not all measure overnight HRV the same way, and those differences matter.
HRV measured during waking hours is noisy. Movement, posture changes, digestion, temperature regulation, emotional state, and the demands of physical and cognitive activity all introduce variability that makes it difficult to isolate the underlying signal you are trying to capture. A reading taken while standing is not comparable to one taken while sitting. A reading taken twenty minutes after exercise is not comparable to one taken at rest.
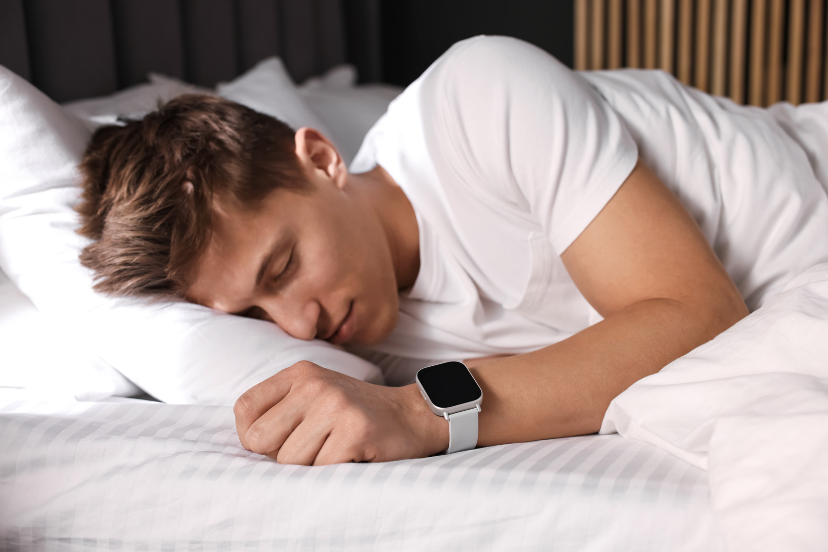
Sleep removes most of that noise. During sleep, the body is not responding to external demands. Posture is stable. Metabolic load is low. The autonomic nervous system shifts toward parasympathetic dominance, the rest-and-recovery branch, and HRV during this period reflects how well that recovery process is proceeding without interference.
This is why overnight HRV is the number consumer wearables report as the primary HRV output. It is the most stable and reproducible reading available from a continuous wrist or chest sensor, and it is the most directly relevant to the question most health applications want to answer: how recovered is this person right now?
This is where something important gets lost in most consumer-facing explanations. Devices do not all measure overnight HRV across the same window, and the differences are not trivial.
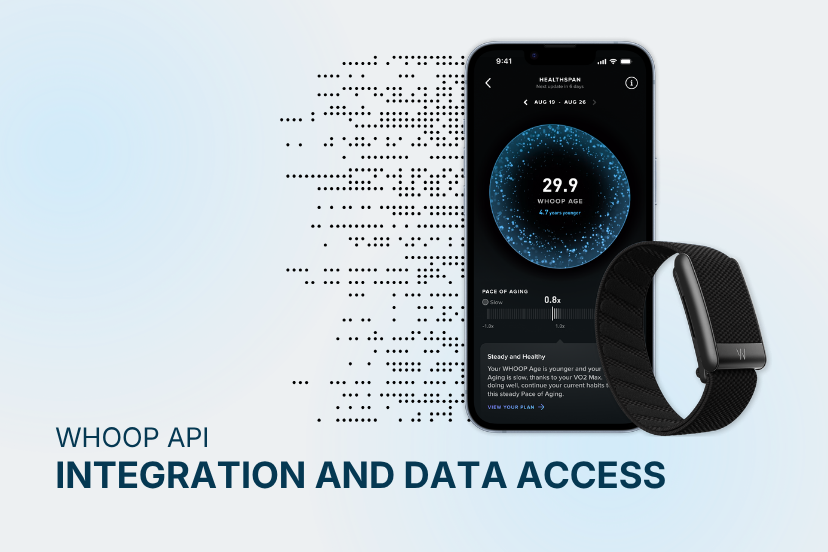
They calculate HRV from the final slow-wave sleep stage before waking. This is a deliberate choice: late-stage deep sleep tends to produce the most stable and reproducible HRV readings, free from the arousal-related variability that can affect earlier parts of the night. The number WHOOP reports reflects that specific window, not the full night.
Oura averages HRV across the full sleep session, with weighting toward deep sleep stages. This gives a broader picture of overnight autonomic activity but may include variability from lighter sleep stages, transitions, and partial arousals that WHOOP's approach filters out.
They report HRV Status, a rolling five-night average derived from overnight RMSSD measurements. A single night's reading feeds into a smoothed trend score rather than appearing as a standalone daily value. This reduces noise from night-to-night variation but means the number reflects the recent trend rather than last night specifically.
Polar measures overnight HRV using continuous chest-strap or optical sensor data across the full sleep session and reports RMSSD as the primary metric.
The practical consequence is that the same person wearing an Oura ring and a WHOOP simultaneously will not receive the same HRV number, even setting aside the RMSSD-versus-SDNN question. They are receiving measurements from different windows of the same night. Neither is wrong. They are capturing slightly different aspects of the same underlying physiology, and comparing them directly is not meaningful without accounting for the methodological difference.
The core of what overnight HRV measures is autonomic nervous system balance during recovery. High overnight HRV indicates strong parasympathetic activity — the nervous system is in recovery mode, cardiac output is being modulated fluidly, and the body is processing the physiological load from the previous day effectively.
Low overnight HRV indicates that the autonomic system is under load. The sympathetic branch, which governs arousal and stress responses, is relatively more active. The body is working harder to maintain homeostasis, whether because of physical stress from training, psychological stress, an immune response, or disrupted sleep architecture.
The HRV reading is not a direct measure of fitness, fatigue, illness, or stress in isolation. It is an integrated signal of how much physiological load the system is under and how well it is recovering from it. What makes that signal useful is that it often shifts before a person consciously notices anything:
The signal leads the experience.
Consumer wearable apps frequently include population comparisons: "your HRV is above average for your age and sex." This context is not useless, but it is not the right way to interpret your own number.
HRV values vary enormously between individuals, and all of the following can be normal:
Comparing any of these to each other, or to a population average, tells you almost nothing about recovery state. What matters is each person's own established baseline and how much they are deviating from it:
The deviation from individual baseline is the signal. The absolute value is context.
This is why longitudinal data matters. The first few weeks of wearing a new device are largely calibration. A reliable HRV baseline requires at least two to four weeks of consistent overnight readings, during which the user is not acutely ill, not in a heavy training block, and not significantly sleep-deprived. Once that baseline is established, deviations from it become meaningful.
Several factors reliably reduce overnight HRV, and understanding them helps distinguish between signal and noise in the data.
Alcohol has a pronounced and consistent effect. Even moderate consumption, one to two drinks in the evening, suppresses overnight HRV measurably. Alcohol elevates heart rate, disrupts sleep architecture (reducing deep and REM sleep), and activates sympathetic tone during the night. The suppression is often visible in the data the morning after and may persist into the following night.
Illness and infection suppress HRV early, frequently before symptoms appear. The immune response activates the sympathetic nervous system, elevates resting heart rate, and reduces HRV as the body diverts resources toward fighting the infection. A sudden unexplained HRV drop combined with a mild resting heart rate elevation is a pattern worth noting.
High training load suppresses HRV in the short term. After intense exercise, HRV typically drops for one to two nights before returning to baseline or rising above it as adaptation occurs. Sustained HRV suppression across multiple days following a training block indicates accumulated fatigue and insufficient recovery.
Psychological stress affects HRV through the same autonomic pathways as physical stress. Chronic work stress, poor work-life balance, and anxiety all correlate with reduced overnight HRV in the medium term.
Sleep disruption, from sleep apnoea, environmental noise, inconsistent sleep timing, or simply poor sleep quality, fragments sleep architecture, reduces time in deep and REM sleep, and reduces overnight HRV independent of other factors.
Late meals and elevated body temperature at bedtime activate digestive and thermoregulatory processes that compete with the parasympathetic recovery state overnight.
Short-term HRV fluctuates daily based on the factors above. Over longer time horizons, it tracks fitness adaptation.
A single overnight HRV reading should not drive decisions. Night-to-night variation is normal, driven by minor differences in sleep position, timing, ambient temperature, and dozens of other factors. A single low reading is noise.
A trend across five to seven nights is signal. When overnight HRV is consistently below an individual's established baseline for a week, something is accumulating, training load, stress, an immune response, a sleep quality problem. That is the pattern worth acting on, not the single bad night.
The same logic applies to improvement. A single high reading after a rest day is not meaningful. A sustained upward trend over two to three weeks reflects genuine recovery or adaptation.
Read more on how to understand wearable trends.
For platforms that use overnight HRV as an input to engagement logic, risk models, or personalized recommendations, two layers of normalization are required.
The first is metric normalization: resolving whether the incoming data is RMSSD, SDNN, or pNN50, since these are not interchangeable values. The second is measurement window normalization: understanding that a WHOOP overnight reading and an Oura overnight reading, even if both express RMSSD in milliseconds, are not derived from identical windows of the same night. Using them as equivalent inputs to a downstream model introduces systematic differences that may be small at the individual level but become meaningful at population scale.
For anomaly detection specifically, identifying when an individual's HRV is deviating from their own baseline in a clinically or behaviorally meaningful way, the baseline needs to be computed from the same device and the same measurement approach. Cross-device baseline comparisons are unreliable, and a user who switches devices mid-program should have their baseline reset, not carried over.
Thryve's wearable API normalizes overnight HRV data across 500+ connected wearables and health data sources, resolving both metric type and measurement window methodology at the infrastructure layer. Partner applications receive a consistent, labeled HRV stream with the source device, metric type, and measurement window documented for every record.
For platforms building anomaly detection, risk scoring, or engagement triggers on top of overnight HRV, this means the normalization problem is solved before the data reaches the application layer. Longitudinal baselines are computed from consistent, comparable data. Cross-user analytics operate on values that reflect the same underlying calculation. And when a user changes devices, the transition is handled without silently corrupting their historical baseline.
Overnight HRV is one of the richest signals available from a consumer wearable. Getting it right at the data layer is what makes it actionable.
If you are building a health platform that uses overnight HRV as a core signal and want to understand how normalization works in practice, book a demo with Thryve.

Friedrich Lämmel is CEO of Thryve, the plug & play API to access and understand 24/7 health data from wearables and medical trackers. Prior to Thryve, he built eCommerce platforms with billions of turnover and worked and lived in several countries in Europe and beyond.