Seamlessly Incorporate Blood Test Results into Your Digital Health Platform

Thryve’s Lab Test Integration enables providers, insurers, and digital therapeutics to integrate clinical lab results into prevention, monitoring, and engagement programs, unlocking deeper insights, personalisation, and outcomes tracking.

Book a Demo
Trusted By
How It Works

What Blood Test Integration Enables:

01
Import Lab Results

Integrate results from routine checkups, chronic disease panels, or digital diagnostics automatically mapped and normalised for clinical use.

02
Visualize Trends Over Time

Display blood markers alongside behavioral data for better longitudinal tracking and patient understanding.

03
Power Personalized Prevention

Trigger tailored programs based on abnormal values (e.g. elevated HbA1c, low ferritin, or high CRP).

04
Ensure Clinical Safety

Use thresholds and alerts based on lab-specific reference ranges and sex/age values to support safe, compliant recommendations.

Why Chatbots?

Supported Blood Markers

While wearable data offers real-time behavioral and biometric insight, blood biomarkers provide the gold standard for diagnosing and monitoring many health conditions, from metabolic disorders and nutrient deficiencies to inflammation and chronic disease progression.

Compatible wearable devices including Apple Health, Garmin, Fitbit, Oura, and Samsung Health

Metabolic Health

Compatible wearable devices including Apple Health, Garmin, Fitbit, Oura, and Samsung Health

Hormones

Compatible wearable devices including Apple Health, Garmin, Fitbit, Oura, and Samsung Health

Nutrition

Compatible wearable devices including Apple Health, Garmin, Fitbit, Oura, and Samsung Health

Organ Function

Care Management

Monitor What Matters, Before It Becomes a Crisis

Give care teams continuous, real-world health data from patients at home. Thryve connects 500+ wearables and medical devices into a single compliant feed, so care managers can act on early signals rather than react to emergencies.
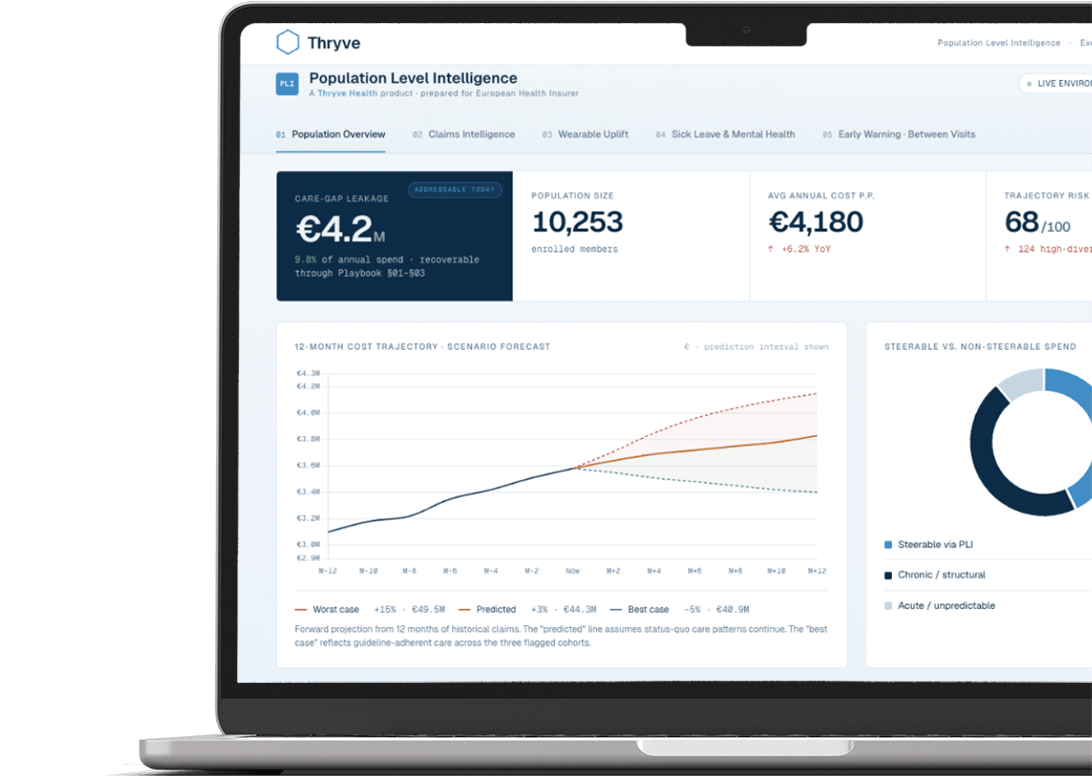
  • Continuous data from 500+ wearables and RPM devices
  • HIPAA and GDPR compliant data pipelines
  • Real-time alerts and retrospective data access

‍

D2C Diagnostics Whitepaper

Seamless Integration with +500 Wearable Devices and Health Data Sources

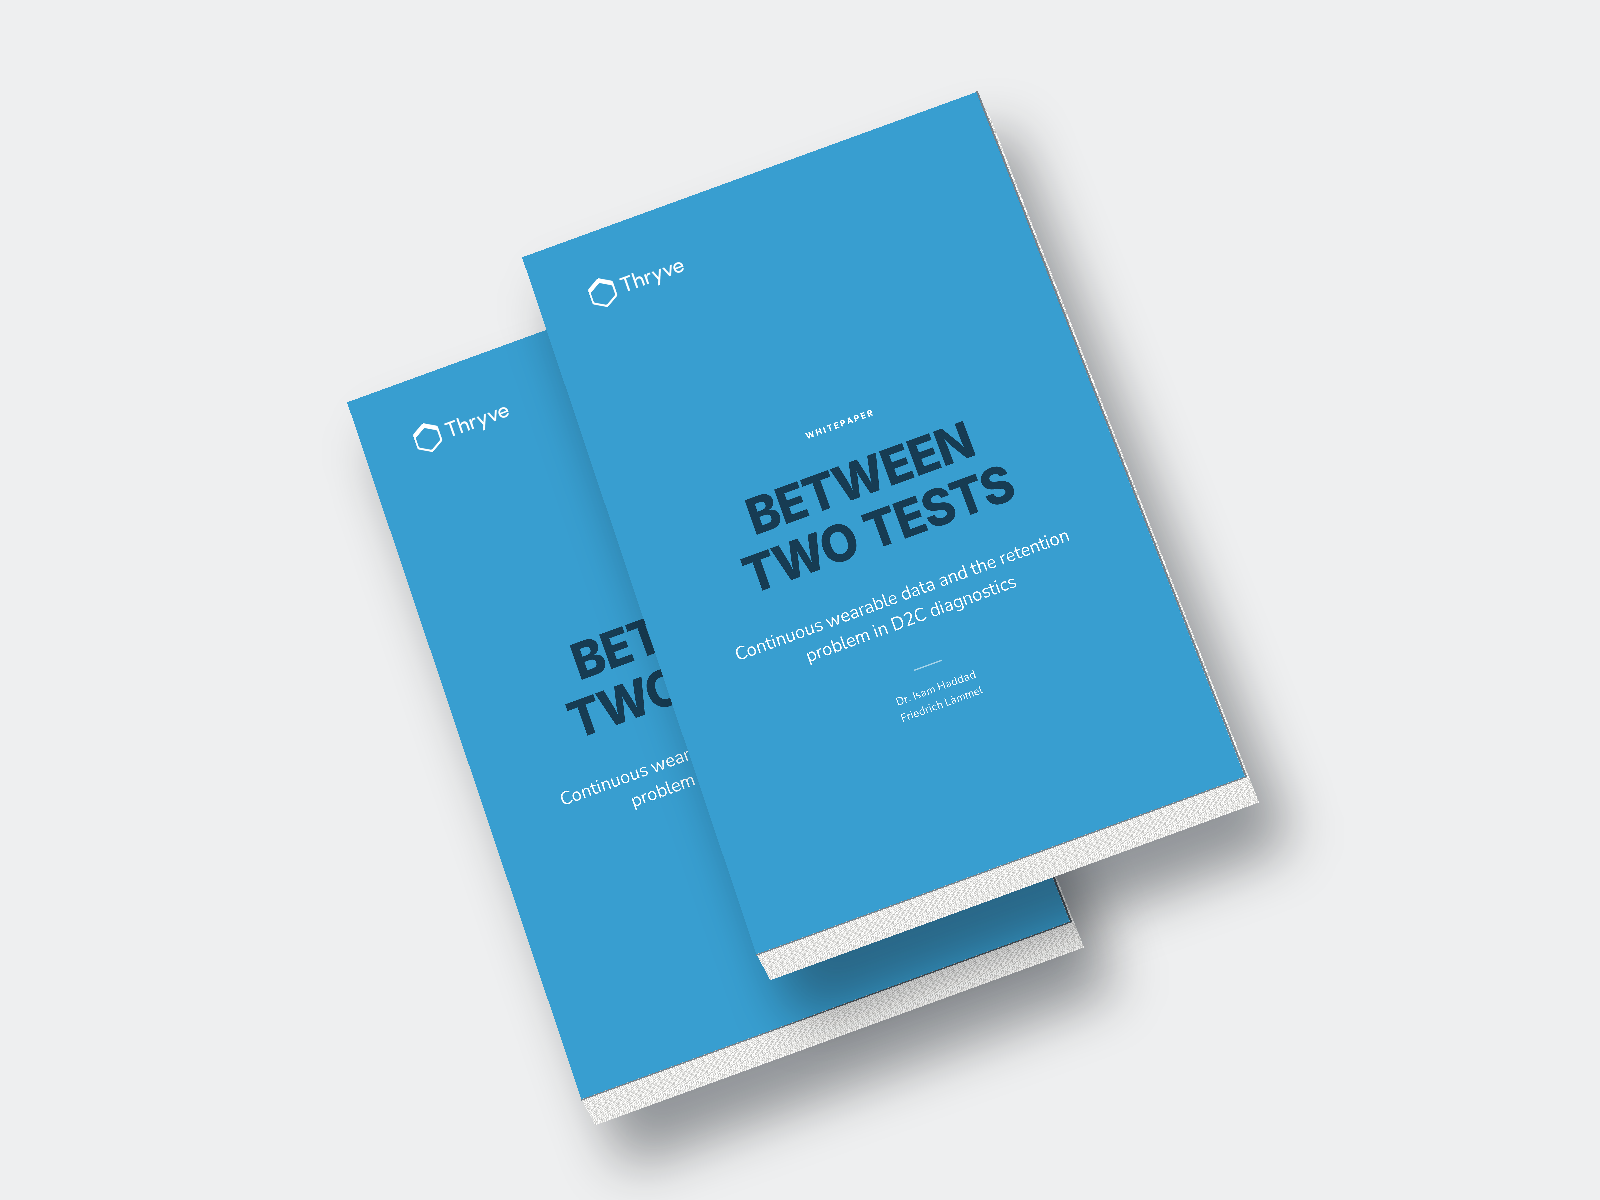
Continuous wearable data read alongside point-in-time laboratory results in direct-to-consumer diagnostics. The paper covers the market record of the past twenty months, where integration adds real clinical information and where it does not, and what the silent interval between two tests costs in lifetime value.

  • Market record: six public moves in twenty months, labs adding wearables and wearables adding labs
  • Clinical evidence: three worked cases, every marker graded as the clinical review set it
  • Commercial model: run it on your own margin, churn and acquisition cost
  • Fifty referenced sources: written for founders, product leads and clinical leads
FAQ

Frequently Asked Questions:

  • How is data privacy ensured?
    • Thryve is fully GDPR-compliant and operates within ISO-certified infrastructure hosted in Germany. All data is pseudonymized, encrypted in transit and at rest, and processed solely on behalf of the customer.
  • Can I combine blood data with wearable data?
    • Yes. Thryve enables the integration of blood data with behavioral and biometric data from wearables and mobile apps to deliver holistic health insights and dynamically personalize goals, nudges, or risk alerts.
  • How long does integration take?
    • Standard integrations (e.g., APIs or lab result ingestion) can be completed within days. More custom implementations — including visualizations or logic workflows — usually take 2–4 weeks.
  • Is this feature suitable for DiGA or MDR-certified products?
    • Yes. Thryve’s infrastructure supports use in MDR, DiGA, and CE-certified applications. The blood integration engine can be used as part of compliant digital therapeutics or clinical decision support tools.
  • Is the data interpreted or just displayed?
    • Both. Thryve normalizes lab values by unit, age, sex, and reference range, and provides:
      • Trend visualizations over time
      • Abnormality detection (e.g., high/low flagging)
      • Risk-based triggers for prevention, education, or care program enrollment